#8 Data Portrait
Objective
You will spend a week tracking a personal habit of yours to create a data-self portrait. Choose the personal habit mindfully — you will need to collect 20 ~ 50 data points for this assignment. Record the data onto a spreadsheet everytime it happens, and translate the spreadsheet into a JSON file. Animate your data self-portrait using setTimeout(), setInterval(), and any of the programming concepts you’ve learned in this class. Include an instruction on your CC portfolio to teach your audience how to read your data self-portrait.

Design process
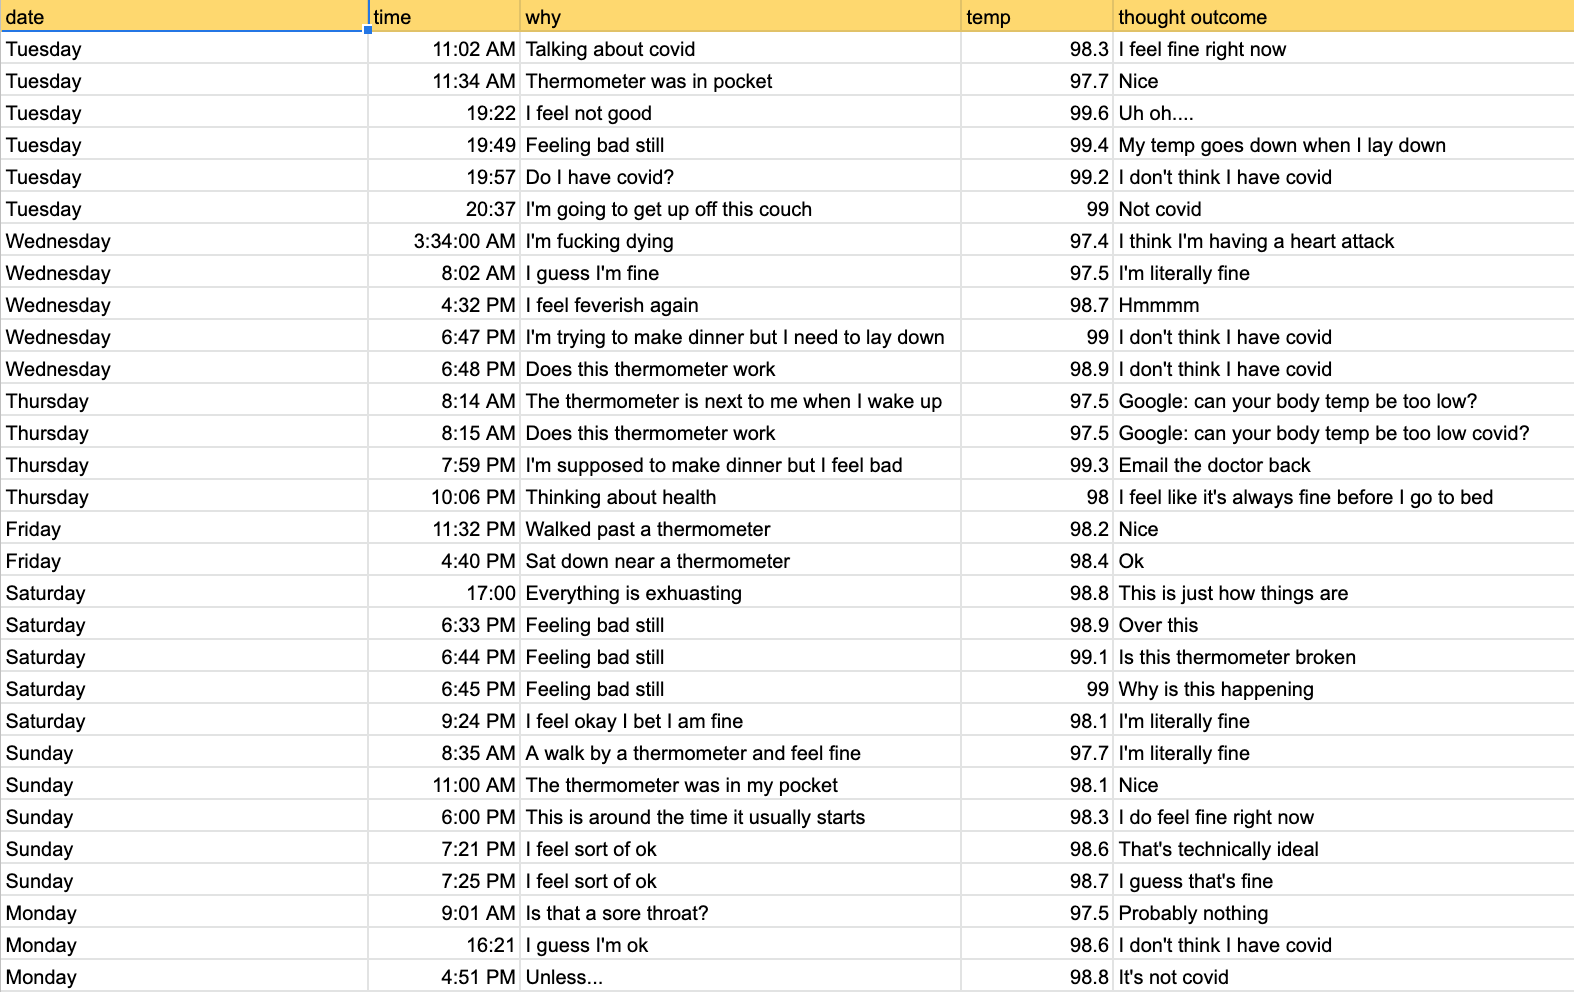
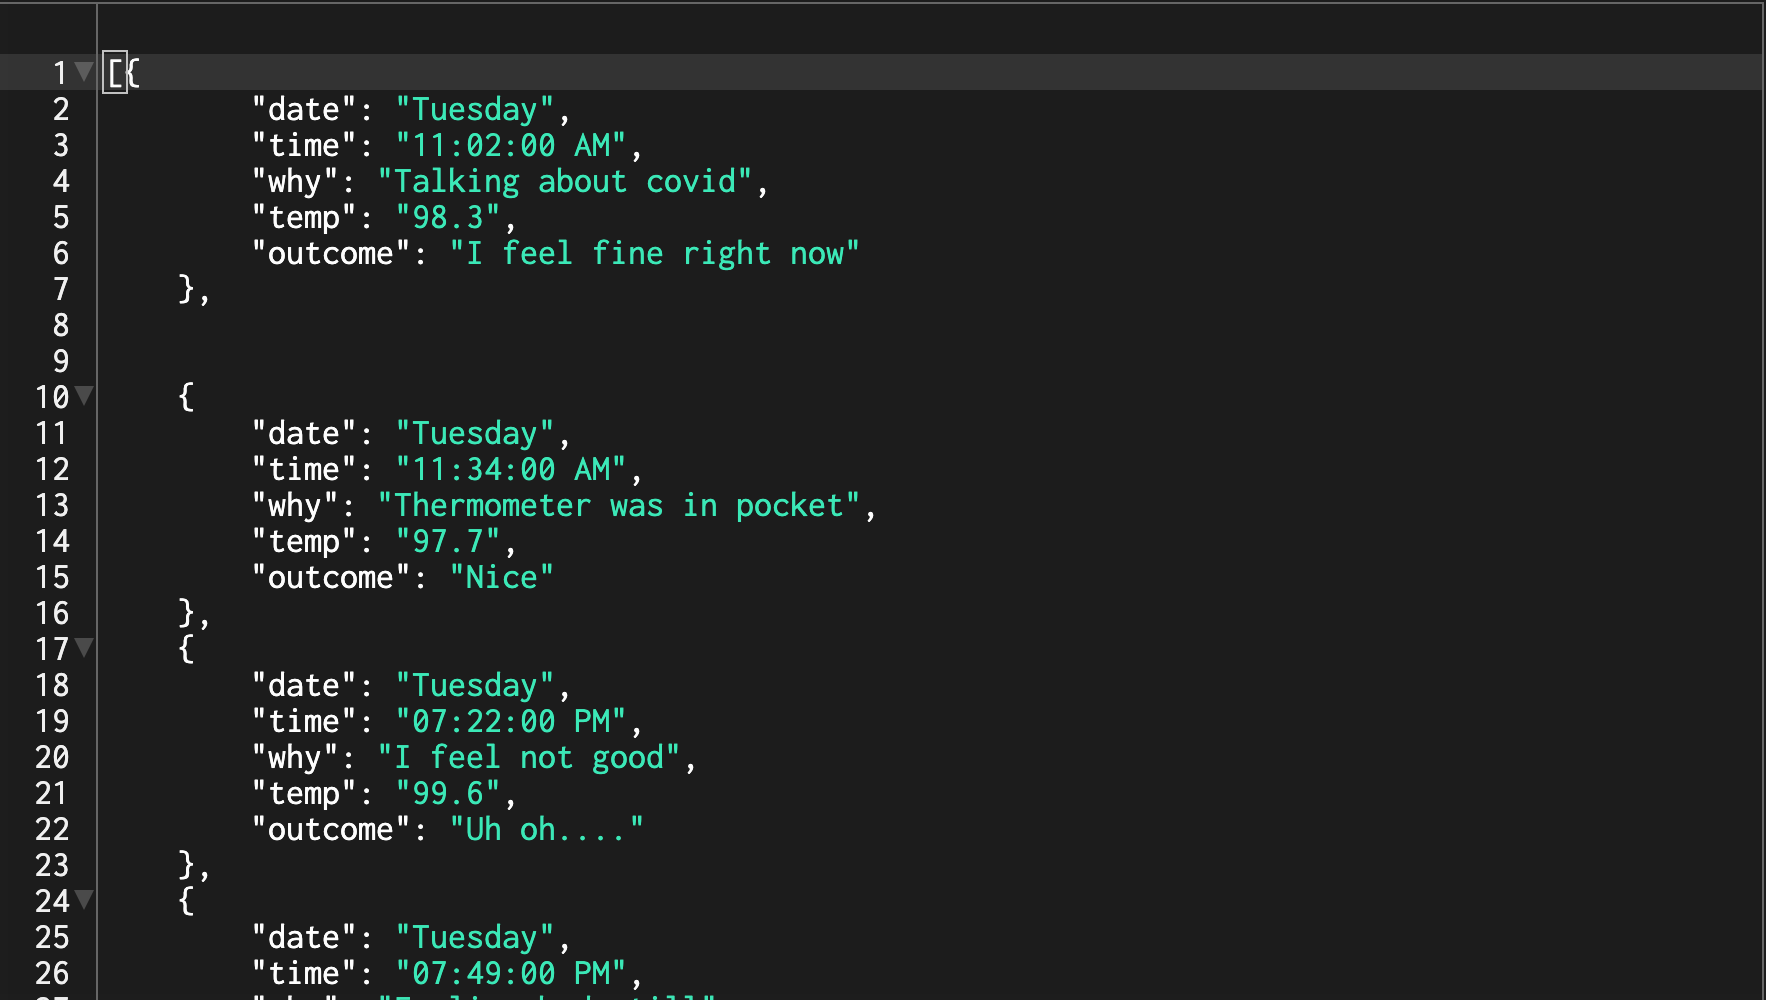
I've been sick for about a month and take my temperature often, so I wanted to explore data as biofeedback for this project. Having a temperature during a pandemic is stressful and it felt like I was constantly checking, so I decided to log my behavior to see how often I was actually using the thermometer. Because I included strings for the data before and after using the thermometer (detailing why I decided to take my temperature and my immediate thoughts when seeing the results), the data serves as a sort of diary of my day. I recorded data in Google Sheets and converted to a JSON file before uploading it to my p5.js sketch.

Reflection
I wanted to be able to show different orb colors by day as well as arrange the x positions based on time. I need to go back through the JSON file and remove AM/PM so time can be read as a number rather than a string. I think for temp, I want to change the numbers to a shape that will change shades based on the increment - I'll add a variable to the (r, g, b) value and create an if statement allowing the color to change based on temp - everything below 98.6 will be a shade of blue, and everything above 98.6 will be an increasingly dark shade of red.